

In thinking about my Substack posts so far, I can see that many of them do not actually “explain the Grid,” which is what the name of my Substack suggests and also is what I intended my Substack to be. To remedy this disconnect between the title of my Substack and its content so far, I am going to write a few posts intended to do that job. I will start out by explaining some aspects of grid operations as they mostly are today, when the penetration of intermittent renewable resources like wind and solar is still relatively small (but growing). Once I have done that, I will spend some time trying to explain how incorporating wind and solar into grid operations will change things.
I am starting off this series of posts by describing the basic cycle of electricity consumption that underlies how all electric systems are planned and operated. This cycle is not complicated and is easy to understand. But it is important you have a clear understanding, so I will go into it in some detail.
I am the type of person who finds visual aids helpful in understanding concepts, so let’s start with a diagram that shows a hypothetical example of the cycle of electric usage, or load, as it is called in the electric industry. Load is the rather intuitive shorthand term used for the amount of electricity being consumed on the Grid at any point in time. If you have ten 100-watt light bulbs in your house, then you have one kilowatt (1,000 watts) of load when they all are turned on. Your light bulbs, plus the electricity being used by everyone else, represent the total amount of load that the electric system on your part of the grid must serve. (please excuse the primitive nature of this diagram, I know more about the grid than I do about graphics)
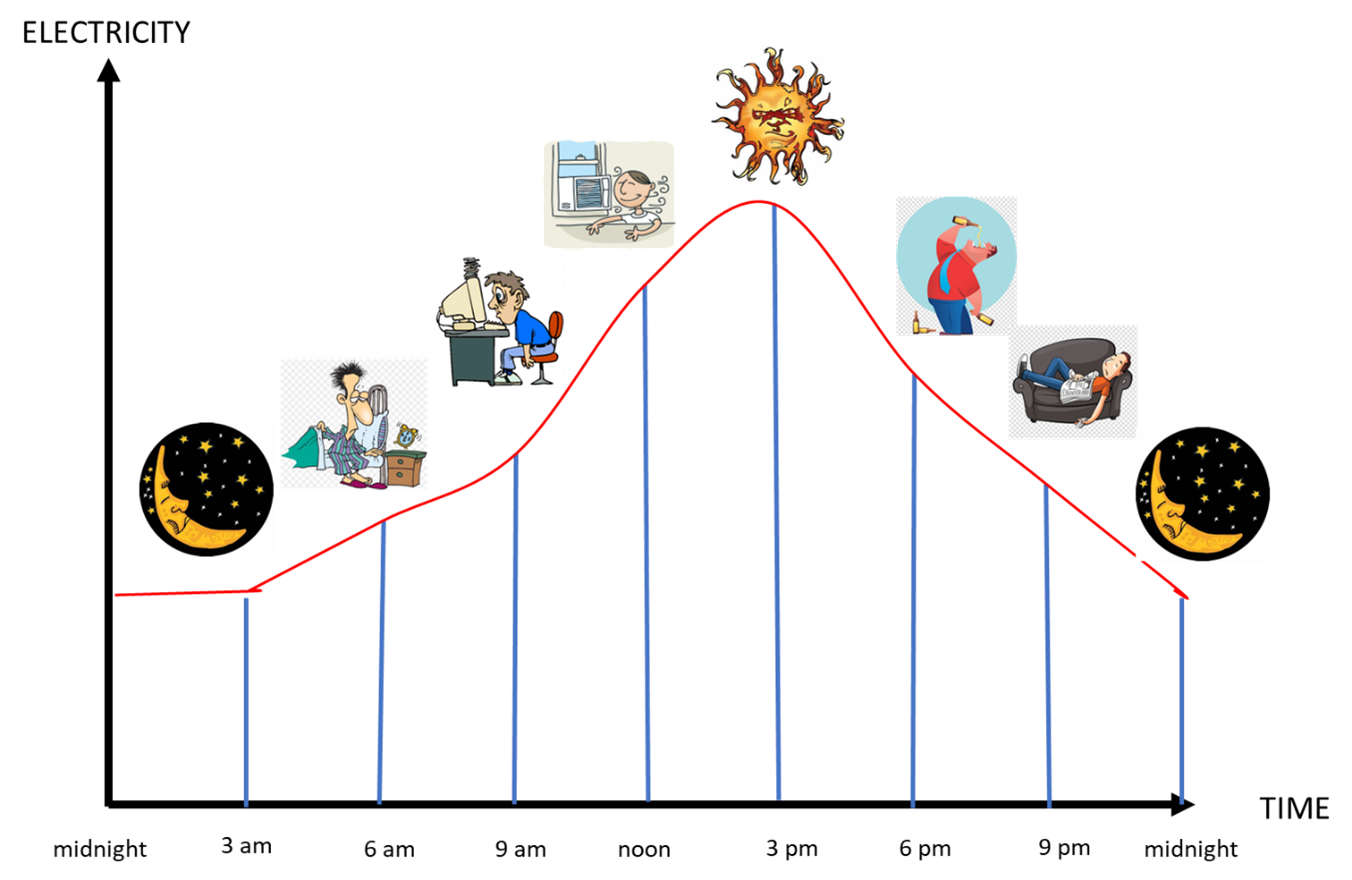
The horizontal line at the bottom of my diagram simply represents the 24 hours of a summer day, and the vertical line on the left represents the amount of load at any point in time. The red line running from the vertical line on the left to the end of the horizontal line on the right can be used to determine the load at any point of time in the day. This line represents the daily cycle of increasing and declining load.
Most humans are asleep between the hours of midnight and three a.m., and when you are asleep you are not watching TV, using your computer, cooking, or otherwise turning electric devices on and off. However, most of us use electricity even as we sleep, for example to power air conditioning in the summer, or to run our refrigerators and other appliances and machines that run 24/7. Outside, there are streetlights shining, and some people do work at night or are night owls awake in the darkest hours of the day. So, as shown on the curve, there is some amount of load between midnight and 3 a.m., but this amount is relatively low compared to the load later in the day.
Eventually, people start to wake up, and as they do, they use more electricity, causing our red line to move up, indicating increased load from 3 a.m. to 6 a.m. Many people then go to work, while children are off to school. This increased activity means that schools, office buildings (at least those with employees who do not work from home), stores, restaurants, and other buildings occupied in the daytime need to be powered up. As a result, our red line continues to move up between 6 a.m. and 9 a.m. More people leave home to go to other locations (e.g. work, school, shopping, etc.) between 9 a.m. and noon, and the sun is getting hotter, which again causes load (and our red line) to move even higher during those hours as air conditioning is turned on. The temperature in the summer typically peaks around 3 p.m., and that typically represents the time of the highest load, so our red line goes up again between noon and 3 p.m.
After 3 p.m., the temperature starts cooling down and in the next few hours people start heading home, perhaps stopping for a drink, followed by dinner, sports or a show on TV, and then to bed. Load steadily moves down and, by midnight, the red line is back to approximately where it was when the day started, and the grid’s cycle starts all over again. The demand curve on most parts of the Grid is not as symmetrical as shown on my diagram, but you get the picture.
The amount of load is affected by factors such as the weather, the season, geographic location, and whether the day is a work/school day or a weekend or holiday. No two days are exactly the same, but the same basic shape of the red line (demand curve) does not vary significantly absent an anomaly, such as a power outage or other emergency conditions. (some of you are probably familiar with California’s “duck curve,” which looks very different. I will explain that when I talk about wind and solar generation)
By now you are probably thinking it is rather obvious that more electricity is used during the day than at night, and when the temperatures are high rather than low. You are probably also wondering why that fact makes any difference to the grid’s operations. Why does it matter?
The answer arises from the fact that electricity must be generated (or released into the grid from storage) at almost the same instant it is consumed. This fact, combined with the nature of the load cycle, has three important implications.
First, it means that the grid must be able to generate (or release from storage) the electricity to supply the maximum load levels (the levels shown at three p.m. on our hypothetical red line) at the exact time the maximum load occurs. This obligation of grid operators to always be able to generate enough electricity to serve maximum load, known as the peak, is the ultimate driver of grid planning and operations. All grid operators must have access to generation facilities—by direct ownership of these facilities or contract with the owners—that, combined, is sufficient to serve the projected annual peak load, plus some amount of margin to account for outages or higher than expected peak loads.
In order to do this, grid operators must keep one eye to the future, with changing peak loads and the addition/retirement of generating facilities. This may require constructing new facilities or contracting with other entities to construct new facilities to be able to meet peak loads in future years.
Second, peaks occur only for a short while, and load frequently is significantly higher during the peak than in the minimum load periods in the middle of the night. Because grid operators must serve all loads on a 24/7 basis, they must consider the best way to serve their loads in each hour of the day in a cost-efficient way. And to date, grid operators have employed a mix of several different types of generation facilities to accomplish this.
Think of it this way. It is more efficient to use a moving van to move all of your furniture and household possessions from one house to another rather than making multiple trips in a car, especially if you are moving to a different city. But you would never use a moving van to move just a couple of suitcases of clothes. Nor would you use a moving van to commute to work. Instead, you would use a car. And you might use a sedan to drive to work, but a van or a SUV to transport your entire family. Similarly, different types of generation facilities have different operating and cost characteristics dictating that they be used in different ways to meet loads over each hour in a 24-hour period.
The following diagram helps to explain this point. It is based on the same red line as our first diagram, but with additional graphics to help understand what is going on.
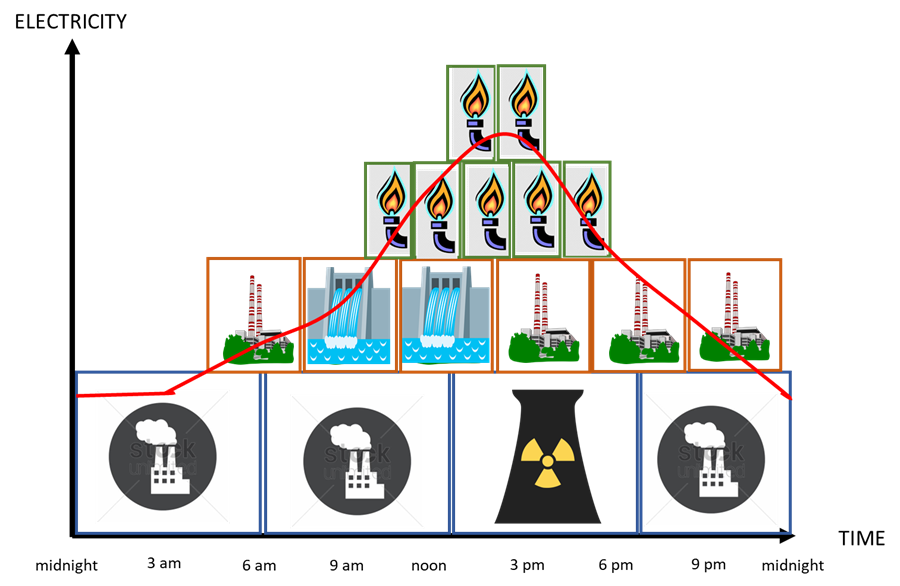
This diagram represents a hypothetical mix of different types of generation facilities used in an electric system that is part of the grid. Each box represents a different generation unit used in the hypothetical.
The bottom row of boxes represents large generation facilities known as “baseload” units. Traditionally, the primary types of baseline units were large coal and nuclear facilities.
Baseload units are the most expensive types of generation facilities to build. But, once constructed, they can generate electricity at a relatively low cost per unit of electricity generated, due to the economies of scale resulting from their large size and the relatively low cost of their fuel. They make the perfect generation facilities to produce electricity 24/7 to serve at least the minimum amount of load in every hour of the day, including the early morning hours when most people are asleep and loads are low.
Given that baseline units can produce electricity at a relatively low cost per unit of electricity generated, why aren’t they used exclusively to serve all load, including larger loads during daytime hours?
As an initial matter, serving all loads with baseload units makes no economic sense. Higher loads occur only during daytime hours, and the highest load levels for only a few hours or less. Baseload units are very expensive to construct. The recently constructed Vogtle Units 3 and 4 nuclear units cost over $34 billion for example. Large coal and natural gas generation facilities are less expensive than nuclear plants, but they are still expensive. A 2020 study commissioned by the Energy Information Administration estimated that the cost of a typical coal plant would be almost $2 billion, and a natural gas combined cycle plant would be just under $1 billion.
It makes no sense to spend this amount of money for a unit that does not operate most of the hours in a year. That would be equivalent to our moving van example of paying for the moving van to move two suitcases of clothes. Just as you would instead use a car to move the suitcases, the grid uses smaller, cheaper, generation facilities to generate electricity to meet loads that exist for a shorter duration of less than a day.
Economics aside, there are operational considerations that make sole reliance on baseload units to supply electricity for an entire 24-hour cycle impractical, if not impossible. Many baseload units are very expensive to turn on, and once they are shut down they cannot be quickly brought back into service. And, because these units are designed to operate for long periods of time, their performance would be affected and maintenance issues would arise if they were repeatedly turned on and off, which would be required every day to satisfy customer demands using baseload units alone.
Moreover, many baseload units cannot instantly change their output, but must slowly “ramp” up and down the amount of electricity they generate. These slow ramp rates make baseload units ill-suited for meeting the constantly changing loads as customers turn their devices on and off.
The other rows of boxes on our graphic represent other types of electric generation facilities that can fill in the gaps more efficiently to serve the shorter-term customer demands for electricity. The boxes immediately above the baseload unit boxes represent “intermediate” units (hydroelectric and natural gas units) that typically are somewhat smaller and somewhat less expensive to construct than baseload units. The costs to operate intermediate units can be higher than those of baseload units, but intermediate units have more flexible operating characteristics than baseload units that permits them to be cycled on and off more frequently and to change their output more quickly. And, just as baseload units are ill-suited to provide constantly changing amounts of electricity, some intermediate generation facilities would have difficulty providing a baseload service of operating 24/7.
The two rows of smaller boxes on the top of the graphic are called “peaking” units or “peakers.” This name comes from the fact that these units (small natural gas and oil units) are used primarily to generate electricity during peak load hours. Many peaking units are relatively small and inexpensive to construct, but are inefficient and more expensive to operate. They are typically not capable of running more than a few hours at a time, and the oldest and least efficient peakers frequently operate only a few hours a year in the hottest hours of the summer.
Different electric systems will have different demand curves resulting from different weather systems. For example, electric systems in locations with hot climates, such as Nevada and Arizona, will have very high peaks of electric usage in the summer months, sometimes referred to as “needle peaks,” when there is a very strong demand for air conditioning. Other systems in more temperate locations will have lower peaks, while systems in colder locations may have higher peaks in winter months when there is a high usage of electricity to provide heating.
Each electric system in the grid has its own unique mix of generation facilities designed to meet the demands for electricity that it provides to its customers. But despite this variation, each system faces the same basic demand curve, with the least amount of electricity consumed late at night and early in the morning, and with demand increasing later in the morning, peaking in the afternoon, and then declining in the later afternoon and early evening.
And electric generation technology is changing. For example, until recently, natural gas-fired generation facilities were mostly limited to providing intermediate and peaking service due to relatively high natural gas prices and limited availability of natural gas. More recently, however, large natural gas-fired combined cycle units have been constructed as new gas supplies have been developed and natural gas prices have declined relative to other fuels. These units are highly efficient and able to quickly start and ramp up and down. Although combined-cycle facilities can continue to provide an intermediate type of service, they also are capable of replacing coal-fired plants in providing baseload service as those coal plants are being retired.
Finally, because the mix of generation facilities used to serve load is constantly changing throughout the day, so too is the cost to generate electricity to serve that load. Each type of generation facility has its own costs to operate, determined largely by the type of fuel used by that facility. And typically, baseload units have the lowest operating costs, followed by intermediate units, with peaking units being the most expensive.
Because the mix of generation facilities is constantly changing, the costs to serve load also are constantly changing. This cost becomes more and more expensive the higher the load, depending on the exact mix of generation units employed. The most expensive electricity as a result is typically the electricity used to serve load at the grid’s peak. And, as we shall see in a later post, the costs of even a small peaking unit employed only during peak periods can have an outsized influence on the price consumers pay for electricity.
I hope you enjoyed this post. I enjoy writing them, and will never charge for subscriptions or ask for donations. I only ask that, if you did enjoy it, you press the “like” button below. Doing so will help me evaluate interest in the book I am writing on grid operations. Of course, if you have a reaction to, or question about, this post, please leave a comment and I will be happy to respond.