
HOW DOES THE EXPLOSIVE GROWTH OF AI'S ELECTRIC DEMAND AFFECT THE PRICE OF ELECTRICITY?
It's Complicated


Those of you who have subscribed to or follow Explaining the Grid for at least the last few months know I have written several articles about how the explosive growth in the demand for electricity to serve AI has affected the grid. Up to now I have focused on the effect of AI on the reliability of the grid. As I have explained, if significant new conventional generation capacity is not constructed in the near future, the grid will not have enough generation capacity to supply all demand for electricity on hot summer days. The result will be persistent rolling blackouts on those days.
In this post I am going to address a different AI issue: the effect of AI on the price of electricity. In my view, this issue is not as important as the issue of whether the grid will be able to meet demand, but it is receiving more national attention. Perhaps this is because prices for electricity have been rapidly increasing since 2024, and these price increases became a major political issue in the recent New Jersey governor’s election. Many theories have been suggested for the cause of the price increases, and the confluence of electricity price increases and AI’s exploding demand has caused some people to place the blame for the price increases on AI’s doorstep.
Recently, a joint study by the Lawrence Berkeley National Laboratory and the Brattle Group (Factors Influencing Recent Trends in Retail Electricity Prices in the United States: What do we know? Where are the gaps?) provided a detailed analysis of the causes of the price increases. Accompanying the study was a set of slides that summarized this analysis.[1] The study did not specifically address the effect of AI on electric rates. However, National Lab/Brattle did analyze the effects of increased demand growth on rates in general. This analysis implicitly addressed the effects of increased demand associated with AI since otherwise there would have been no compelling reason to do the analysis.
The results of this analysis are summarized on slide 35 of the National Lab/Brattle slides. It shows that, contrary to the claim that increased demand from AI is causing electric price increases, over the last five years the states with the highest demand growth actually saw a decline in their electric prices. By contrast, states whose demand declined often saw increases in the price of electricity.
On its face, this is counterintuitive. Why did it happen? Think of it this way. Suppose you agree with two other families to share a beach house and split the cost of the house equally. You find a house everyone likes. It rents for $1,200. You notice, however, that there are more rooms than you need, and you could fit in a fourth family. Even though more people would be staying in the house, the rental fee does not change. As a result, adding a fourth family would reduce the price each family has to pay from $400 ($1,200/3) to $300 ($1,200/4). As this example illustrates, sharing fixed costs among more people means, as a matter of math, each person’s share of the costs is less.
Similarly, up to now, the grid has been able to supply electricity to the AI data centers without needing to construct much new infrastructure. As a result, just as it was possible to add a fourth family into our beach house and reduce the cost each family pays for the house, increasing the demand for electricity allows the fixed costs of existing infrastructure to be shared among a greater amount of electricity sales. And as a matter of math, sharing a set amount of fixed costs over a greater amount of electricity sales reduces the price per megawatt of the electricity being sold.
Importantly, the National Lab/Brattle study is based simply on an analysis of electricity prices from 2019-2024. The study’s conclusion about the effect of demand growth on electricity prices is not meant to describe a universal relationship between demand and electricity prices that has existed and will continue to exist in the future. Instead, slide 35 explicitly states that “this relationship need not always exist.” Demand growth can cause electricity prices to increase in the future “if new supply and delivery infrastructure is constrained and costly.”
What does this mean? Let’s go back to our beach house for an illustration. The four families had such a great time together at the beach that they decide to invite another family to join them the next year. However, the old beach house cannot accommodate all five families. They decide to rent two houses next to each other, and because costs have gone up, the combined rent of the two houses is $2,500. As a result, even though the total rental cost is being divided among more families, the total cost has also increased. This means that each family’s share has increased from $300 to $500 ($2,500/5). Similarly, if the grid is required to construct expensive new generation and transmission facilities to serve increased AI demand for electricity, that could increase the price of electricity if the increase in demand does not fully offset the increase in cost.
And it seems likely that expensive new infrastructure will be required to meet AI’s rapidly increasing demand in the future. Today, the capacity supply situation in many regions of the US is very tight. In fact, the North American Electric Reliability Corporation (NERC) concluded in May of 2025 that four large regions, covering all or part of 23 states, were facing an “elevated” risk of blackouts during “extreme conditions.” [2] These conditions did not occur and, as a result, there were no blackouts resulting from a shortage of generation capacity. But there is a serious question whether the grid will be able to continue to supply all demand for electricity in the future using only the grid’s existing infrastructure and currently planned additions. In July, the Department of Energy (DOE) issued a report analyzing the potential for blackouts in 2030 under current plans. DOE found that, given the increase in demand to serve AI, the risk of blackouts in 2030 would increase by a factor of 100 if no steps are taken to increase the grid’s generation capacity.[3]
This means, as I have written in several previous articles, that extensive new investment in infrastructure will be needed to meet all demands for electricity as those demands increase in the future. Much of this will need to be investment in new generation facilities, but there will also need to be investment in transmission facilities. It is not clear whether the resulting increase in the fixed costs of the grid’s infrastructure will be offset by the increased demand for electricity. But it appears to me it is likely the price increases resulting from the need to recover the fixed costs of new facilities will out strip the price decreases resulting from sharing those costs among a greater amount of sales. This is especially the case given that increases in the cost of transmission facilities are greatly outpacing inflation, as shown on slide 29 of the National Lab/Brattle slides.
There also is another way increased demand could cause the price of electricity to increase in the future that was not mentioned in the National Lab/Brattle slides. To illustrate this, I am going back to my favorite graphic (which is my favorite not only because I created it but because it helps to explain a lot about electric markets). I call this graphic THE STACK, which made its debut in Explaining the Grid Part Three—Market Products, and then made a repeat appearance in Explaining the Grid Part Four—RTO Energy Markets. You can pass over this brief discussion if you are familiar with THE STACK. But Substack is not like a book where everyone has read all the previous chapters, and I am going to do this again for those of my newer readers who haven’t read those relatively old posts (but if you are interested in how the grid works, you should read those posts).

If you already read either of my previous posts where THE STACK made an appearance, then you know how this works. To recap, all offers to sell electricity in an RTO wholesale market are stacked, from lowest cost offer to highest cost offer. The RTO then determines how much customer demand exists—either in real time for energy markets, or projected for the year in capacity markets, and then compares the total amount of customer demand with THE STACK. The highest priced offer needed to serve the last megawatt of customer demand—known as the marginal offer or the market-clearing offer—and all lower priced offers, receive awards to sell electricity. And every winning generator is paid the market-clearing price even if it offered to sell at a lower price. If you want to know why everyone gets that price, read Explaining the Grid Part Four—RTO Energy Markets.
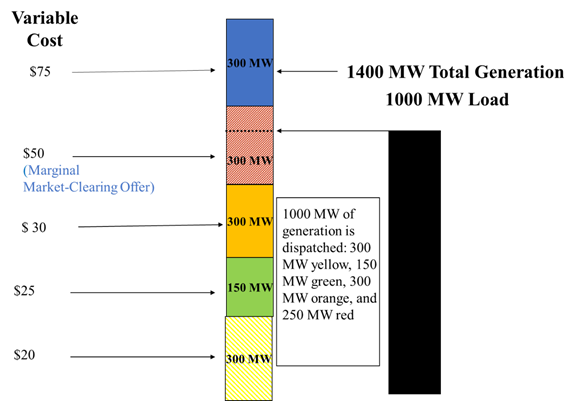
If you look at THE STACK, you can probably figure out quickly how an increase in demand can increase the price of electricity. If an increase in demand results from AI’s need for large amounts of electricity, the total demand can easily move up the stack to the next highest cost offer to sell electricity, as shown by the following version of THE STACK:
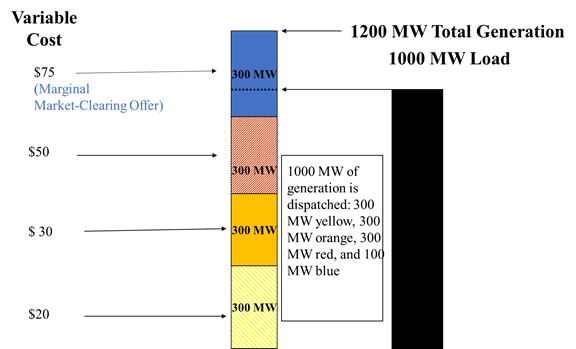
In this version of THE STACK, demand has increased by 150 MW, which has moved the price of the marginal market-clearing price from $50 to $75. And this means the entire 1,000 MW of electricity is sold at a price of $75/MW, a $25/MW increase in price caused by AI’s demand for electricity.
The actual setting of prices in RTO markets is much more complicated because there are hundreds, if not thousands, of offers submitted into those markets, and in the energy markets prices are calculated as often as every five minutes. And because there are so many more offers being submitted, the difference in prices between offers is usually much less than shown in my STACK graphic. But the general principle is the same. An increase in demand for electricity will cause an increase in the wholesale price of electricity, at least in the short run. And because retail electricity prices are based on the wholesale price (plus additional costs), an increase in wholesale prices will cause a corresponding increase in the retail price of electricity paid by consumers.
This does not necessarily mean that the increased demand for electricity caused by AI will cause prices in the RTO wholesale markets to increase in the longer term. As demand for electricity in an RTO increases, so will the amount of generation capacity (hopefully). And if the new generation capacity is able to offer its electricity into the market at a relatively low price, that lower price offer could offset the price effects of the increase in demand, or even allow a decrease in the RTO market price. This is illustrated by the third and last of my STACK graphics. In this graphic, the 150 MW increase in demand is accompanied by an offer from a newly constructed low cost generation facility (shown in green on THE STACK) at a price of $25. This new offer moves the higher priced offers up in the stack so that the marginal offer once again comes from the facility offering to sell at $50. As a result, the 150 MW increase in demand was offset by the new low cost generation facility, and the increase in demand had no effect on the market-clearing offer price, returning the market price to $50, where it was before AI caused the demand for electricity to increase.
It is impossible to know today whether and when newly constructed generation facilities might offset increased AI demand. But for the near future at least, it appears likely that demand will increase faster than supply. If that happens, the likely result will be an increase in the price of electricity.
In accordance with my new publishing schedule intended to give me more time to work on my book, my next Substack post should come out some time in the middle of December. In the meantime, I hope that all of you have a great Thanksgiving.
***
I hope you enjoyed this post. I enjoy writing them and will never charge for subscriptions or ask for donations. I only ask that, if you did enjoy it, you press the “like” button below. And please consider sharing my posts with other people you think might be interested. Doing so will help me evaluate interest in the book I am writing on grid operations. Of course, if you have a reaction to, or question about, this post, please leave a comment and I will be happy to respond.
[1] The study, the slides, and other related documents can be found at: https://eta-publications.lbl.gov/publications/factors-influencing-recent-trends.
[2] NERC, 2025 Summer Reliability Assessment (May 14, 2025).
[3] DOE, Evaluating the Reliability and Security of the United States Electric Grid (July 7, 2025).
Thank you for taking the time to write these posts, they are very helpful. I’ve been doing regulatory work for about 20 years, and I think that there’s a lot of interest in understanding this information. Your explanations are clear and again, very helpful, thank you.