


RENEWABLE GENERATION HAS AN OUTSIZED EFFECT ON RTO ENERGY MARKET PRICES

I swore to myself after last week’s post that I would hold off for a while on writing about renewable generation. Many of my recent posts have covered this topic, but there are other interesting issues involving the grid that also are worthy of discussion. After making this promise to myself, I realized there was one more point I wanted to make, so here is yet another post on renewables. I didn’t make the commitment not to write about renewables to anyone other than myself, so the only one who can complain about this is me.
Up to now, my posts have focused on renewables’ costs and their effect on the costs of electric systems. Today, I am going to discuss the effect of renewables on the prices for electricity charged by Regional Transmission Organizations (RTOs). It’s a related issue; after all prices for electricity have some relationship to costs. But the effect of renewables on RTO energy prices is quite different from their effect on costs.
In order to understand my analysis, it is necessary to understand a couple of aspects of grid operations and how RTO energy prices are determined. I have discussed these issues in past posts, with the greatest detail provided in my five-part “Explaining the Grid” series of posts. However, not everyone has read my prior posts and, for those of you like me with short term memory problems, you might not remember what I wrote even if you read those prior posts. So I am going to do a quick review, aided by some basic graphics that are (barely) within my limited graphics capability.
. Let me start with two graphs I provided in one of my earliest posts, Explaining the Grid, Part One.

As explained in detail in my earlier post, this first graph shows how the demand for electricity varies during each day. Demand is at its lowest early in the morning, and increases later in the day as people wake up and engage in their daily activities. Demand peaks in the mid-afternoon when temperatures are at their highest. Demand for electricity then decreases as people return home and eventually go to bed, at which time demand returns to approximately the same low level late at night.

This second graph shows how, until recently, the grid was designed to supply these varying levels of demand. Large baseload generators, mostly fossil or nuclear, operated around the clock to supply the base level of demand that exists 24/7. Smaller intermediate generators operated during most of the daylight hours, and yet even smaller peaking generators operate during the highest hours of demand. The variable cost (primarily the cost of fuel) to operate these generators was lowest for the baseload units, second lowest for the intermediate units, and most expensive for the peaking units. Operating the least expensive units as much as possible and the most expensive units as little as possible was, and continues to be, the most efficient, least expensive approach to supplying electricity to consumers.
Today, we also have renewable generators. These generators are not capable of supplying baseload service because they cannot operate on a 24/7 basis. As a result, they are in some respects like the peaking units or, perhaps, the intermediate units shown on the second graph. But there is one major difference. Unlike intermediate units and, especially peaking units, renewable generators are not expensive to operate. To the contrary, renewable generators are very inexpensive to operate because they do not require fuel to generate electricity.
With this basic understanding of how different types of generators operate to meet the demand for electricity as it varies throughout the day, lets now look at how RTOs set prices for energy. Prices are established through competitive auctions, in which each potential seller submits an offer to sell electricity at a stated price. As I explained in my earlier posts, these offers tend to be at or near the variable operating cost the generator incurs to produce electricity. RTOs then establish their prices based on these offers, using what is called a stack. Here is a graphic that is useful in conceptualizing how a stack works. It is similar to graphics I used in Explaining the Grid, Parts Three and Four.

This illustrative stack includes four generation facilities. The two submitting the lowest cost offers ($20 and $30) are submitted by baseload units, which tend to have the lowest operating costs of all conventional generators. The facility submitting the $50 offer is an intermediate facility. And the $90 offer is submitted by a peaking unit, which tends to have the highest costs in an electric system.
The graphic also shows that customer demand at the peak time of demand (i.e. the of the greatest demand for electricity on a particular day) is 950 megawatts. This means that the RTO will need to select 950 megawatts of capacity out of the 1,000 megawatts of offers submitted. This selection is done using the stack, in which the offers are stacked in price order, with the lowest price offer ($20) at the bottom and the highest price offer ($90) at the top. The RTOs then see how far up the stack they have to go to meet customer demand at the time the auction is run. In this case the auction is run at the time of the highest demand of the day, which means that 950 megawatts of generation capacity is needed to meet the demand. In order to meet this large amount of demand, the RTO has to select 50 megawatts of the $90 peaking facility, plus all 900 megawatts of capacity whose offers were lower than $90.
Now for the part that is crucial for understanding how renewable generators affect RTO prices. The highest price offer for electricity that was needed by the RTO to supply customer demand (the $90 offer submitted by the peaking unit) is considered to be the marginal, or market-clearing offer. AND ALL GENERATORS SELECTED TO SUPPLY ENERGY ARE PAID THE $90 OFFER EVEN THOUGH ONLY 50 MEGAWATTS OUT OF 950 MEGAWATTS OF CAPACITY WAS OFFERED AT $90. The units offering at $20, $30, and $50 are all paid the same $90 as the peaking unit submitting the $90 market-clearing offer. There are good reasons for this counterintuitive result, as I describe in Explaining the Grid, Part Four.
Why is this fact crucial for understanding the rate effect of renewables? Let me explain with a graphic almost identical to the one above, except that I have added an offer submitted by a 75 megawatt solar generator. Solar generators have low variable operating costs because they do not need fuel to generate electricity—they generate electricity from sunlight. As a result, the solar generator is able to offer its electricity at $1.

As this graphic shows, the $1 offer is the lowest cost offer, so it is placed at the bottom of the stack. This moves all other offers up the stack, with the result being that the $50 offer is now the marginal market-clearing offer, and the price of all electricity is set at $50 instead of $90. This represents a tremendous rate saving for customers. Without the solar panels, the total rate paid for the 950 megawatt-hours of electricity demand is $85,500 ($90 x 950). With the addition of just 75 megawatts of solar panels, the total rate paid for 950 megawatt-hours of electricity is reduced to $47,500 ($50 x 950). This is an approximately 45% rate reduction enjoyed by all of the RTO’s customers resulting from an offer representing less than eight percent of the total amount of energy sold in the RTO market.
I should note it is very unlikely there ever would be a price difference of $40 between two offers in a stack, as I showed in my hypothetical. However, the cost differences between offers in RTOs are greater at the top of the stack than they are between lower cost offers lower down in the stack. I used this large price difference to highlight the fact that a relatively small number of low cost offers can have an out-sized effect on the price in the RTO energy markets during peak demand periods. Moreover, the size of the RTOs is much greater than the 950 megawatts shown in my hypothetical. The peak demands of RTOs range from about 20,000 megawatts to over 130,000 megawatts. Consequently, the reduction in the total price paid for all energy sold in an RTO energy market is much greater than I have shown, even if the reduction in price per megawatt-hour is much less than in my hypothetical.
I decided yesterday to do a bit of a reality check on my theory that renewables can play an important role in dampening the high energy prices that can result from the high demand that exists in hot weather. Yesterday was not as hot in most parts of the country as it has been for much of the last week, but it still was a reasonably hot day. Each of the RTOs has real time data displayed on the first page of its web site—updated every five-ten minutes— that shows the currently operating generation mix, prices, demand, and other data.[1] I looked at this data yesterday (Sunday, July 13) for five of the seven RTOs (all but New York ISO and ERCOT) at four different times; approximately 10 a.m., 1 p.m., 3 p.m., and 6 p.m. For each of these times I noted the generation mix—particularly the amount of solar and wind generation—and the prices prevailing in each RTO.
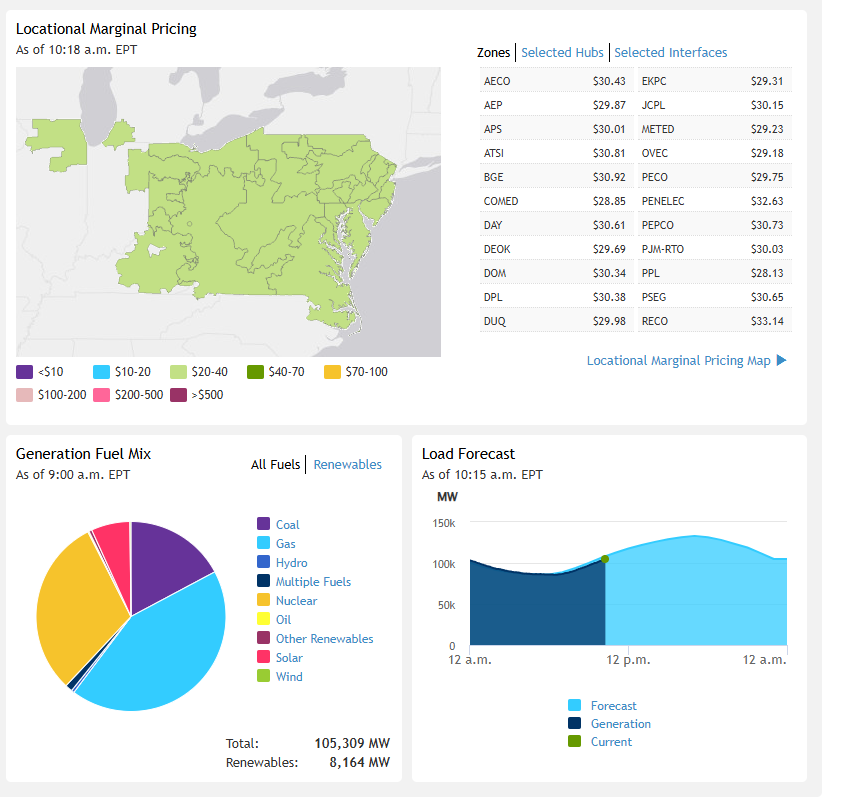
Below, I am showing the screen shots I took of the PJM website. Each website is somewhat different, but these screenshots are representative of what the other RTO websites also showed.
PJM 10:18

PJM 12:45

PJM 3:16

PJM 5:40

As you can see, the web sites don’t show the prices at which generators offer their energy. As a result, I couldn’t directly check whether low cost renewable price offers were being made that pushed high cost offers from peaking units above the marginal cost offer, as shown on my illustrative graphic. But I could see that the amount of electricity produced by renewables generally increased as demand increased. The screenshots above show that, in PJM, the amount of renewable energy produced in PJM was at 8,164 megawatts at 10:18 a.m. when demand was a bit over 105,000 megawatts. The total amount of renewables rose to 13,807 megawatts at 5:40 p.m., when demand had risen to over 133,000 megawatts. Similarly, the total amount of renewables rose to over ten percent of all electricity being produced in three out of the other four RTOs, and over nine percent of all electricity produced in SPP, the other RTO I was monitoring.
Most, if not all, of this renewable energy offered into the RTO energy markets was likely offered at relatively low prices. Consequently, it seems almost certain that energy prices were dampened below what they would have been if no renewable energy had been produced. This conclusion is supported by the fact that, even though it was a relatively hot day, the price increases in every RTO as the temperatures increased were for the most part quite modest. For example, you can see from the PJM screenshots that prices were generally in the $30s at 10:18, and had increased only to the $50s at 5:40 even though demand had increased substantially. There were a few pockets where prices spiked higher, but these were caused by transmission constraints that prevented lower cost energy from being transmitted into the high cost area. It seems likely that prices in the RTO energy markets would have been higher if there had been no renewables in the generation mix and instead high cost peaking units had been used to meet demand.
And it is important to keep in mind the RTO market approach to pricing, where every generator is paid the market-clearing price. If, as the price data suggests, low cost offers from renewables prevented the market clearing price from rising higher, that lower price did not apply only to the energy produced by renewable generators. It also reduced the price paid to the other generators, who produced about 90 percent of the electricity sold in the RTO markets.
I have read arguments to the effect that the rate-reducing effect of renewable generators is due to the federal tax credits paid for each megawatt-hour of electricity wind and solar generators produce. There is some truth to this argument during periods of very low demand during the night, when RTO energy prices sometimes plunge down to, and even below, zero (i.e. generators must pay the RTO for each megawatt-hour of energy they deliver). In those low demand periods, the tax credit makes the production of energy profitable even when the RTO price for energy falls below zero. But most of the time, energy market prices are positive. At these times, renewables can offer their electricity in the RTO energy markets at prices close to zero even without a tax credit. This is because renewables do not incur the cost of fuel to generate electricity.
We can argue about whether the price-suppressive effects of renewables on RTOs is a good thing or a bad thing in the long run. As I have noted in other posts, low RTO energy prices have created economic pressures on large baseload generation facilities that are necessary to ensure the grid’s reliability. Serious reliability issues will result if nothing is done to provide the necessary economic support for the continued operation of existing baseload generation and the construction of new baseload generation. But it cannot be reasonably disputed that, at least in the short term, renewable generators can provide an outsized rate benefit in the RTO energy markets that extends far beyond the energy renewable generators produce themselves.
***
I hope you enjoyed this post. I enjoy writing them and will never charge for subscriptions or ask for donations. I only ask that, if you did enjoy it, you press the “like” button below. Doing so will help me evaluate interest in the book I am writing on grid operations. Of course, if you have a reaction to, or question about, this post, please leave a comment and I will be happy to respond.
[1] These website addresses are: pjm.com (PJM); Iso-ne.com (ISO New England); Nyiso.com (New York ISO); Misoenergy.org (MISO); SPP.org (SPP); Ercot.com (ERCOT); and Caiso.com (California ISO).
So Matt, I live in California, which has a substantial renewables portfolio of wind and solar. If renewables are supposed to pull down grid clearing RTO prices, why does California have the highest electricity prices per kWh in the U.S.?
Your insights are always interesting. But your points only hold in the short term. The variable cost of renewables and resultant price is very low even without subsidies. But this short term view belies their full cycle costs and the effective price to society. (i.e. Subsidies are a “price” paid by taxpayers More importantly, the longer term costs and resulting required prices for sustainable supply that are caused by all of the necessary redundancies (low capacity factors, back up caused by redundancies whether they be batteries which are idle investments when charging or hydrocarbon back up which is idle when renewables are producing). It may turn out that renewables ultimately are cheaper in the long run, but your argument about short term pricing that is largely if not completely related to variable costs is incomplete and short sighted. I’d like to see your full cycle analysis.